Critical r table (significance of a correlation)
A table of critical values for Pearson's correlation coefficient: the smallest |r| that is significant at your α, given the number of pairs n. Use the lookup box to check an observed r, or read the printed table below, from n = 3 to n = 100.
0.05 is the usual choice.
The number of (x, y) pairs in the sample.
The Pearson correlation you computed, between −1 and 1.
Show the working, step by step
The test of H₀: ρ = 0 on n pairs has n − 2 degrees of freedom.
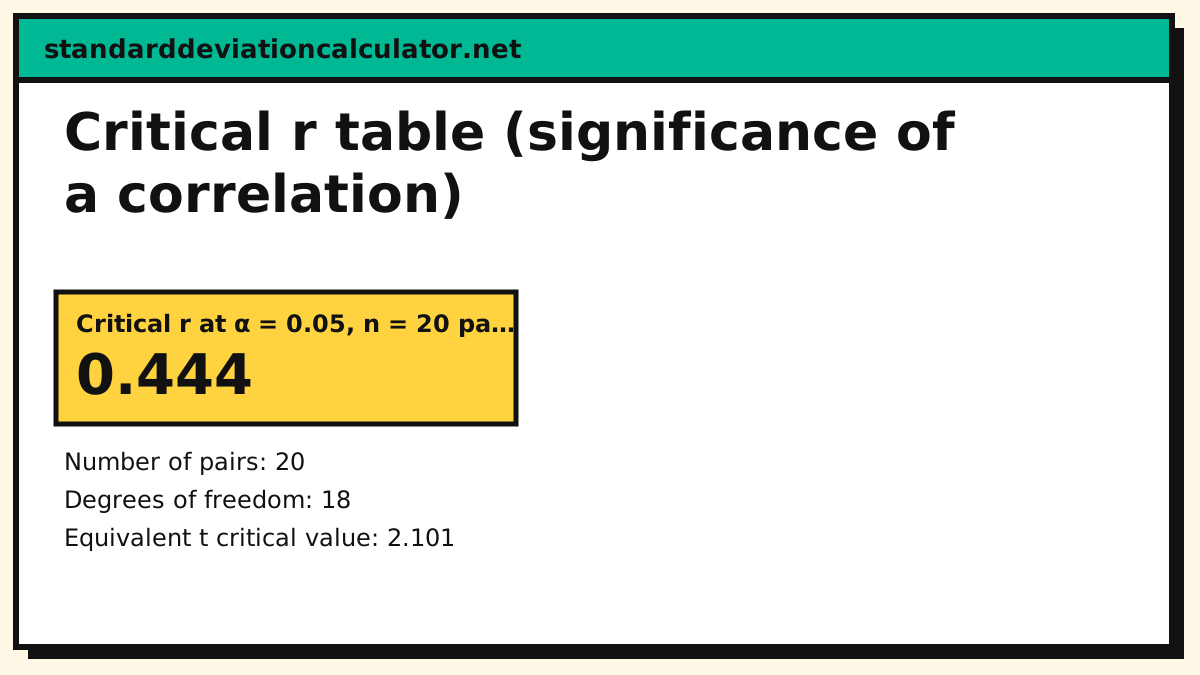
df = 20 − 2 = 18
Take the two-tailed t critical value and convert it to the r scale:
r* = 2.101 / √(2.101² + 18) = 0.444
Small samples need a large |r| to clear the bar; the table shows the drop-off as n grows.
At n = 25 the same α gives r* = 0.396
Same tCriticalAlpha as the t-table page; the r scale is just the t critical value run through r* = t*/√(t*² + df).
How to read the table
The rows are the number of pairs n and the columns the significance levels, two-tailed. A cell is the smallest absolute r whose correlation with zero is still significant at that α. Compare it with your sample r; the sign of r is irrelevant to significance.
Worked lookup for n = 20, α = 0.05:
- Find the row n = 20.
- Find the column 0.05.
- The cell reads 0.444 (highlighted below).
- A sample correlation with |r| ≥ 0.444 rejects H₀: ρ = 0 at the 5% level; r = 0.40 does not.
| n | 0.1 | 0.05 | 0.02 | 0.01 |
|---|---|---|---|---|
| 3 | 0.988 | 0.997 | 1.000 | 1.000 |
| 5 | 0.805 | 0.878 | 0.934 | 0.959 |
| 10 | 0.549 | 0.632 | 0.715 | 0.765 |
| 15 | 0.441 | 0.514 | 0.592 | 0.641 |
| 20 | 0.378 | 0.444 | 0.516 | 0.561 |
| 25 | 0.337 | 0.396 | 0.462 | 0.505 |
| 30 | 0.306 | 0.361 | 0.423 | 0.463 |
| 40 | 0.264 | 0.312 | 0.367 | 0.403 |
| 50 | 0.235 | 0.279 | 0.328 | 0.361 |
| 60 | 0.214 | 0.254 | 0.300 | 0.330 |
| 80 | 0.185 | 0.220 | 0.260 | 0.286 |
| 100 | 0.165 | 0.197 | 0.232 | 0.256 |
Where the numbers come from
Testing H₀: ρ = 0 on n pairs reduces to a t-test: the statistic t = r √(n − 2) / √(1 − r²) is t-distributed with n − 2 degrees of freedom under the null. Solving that for r gives the critical value used by this page,
r* = t* / √(t*² + (n − 2)), t* the two-tailed t critical value at α, df = n − 2
Two consequences are visible in the table. First, r* falls with n: with n = 10 the 0.05 bar is 0.632, with n = 100 it is 0.197, and with n = 1000 it is 0.062. Second, the large-n limit is the z-based value z*/√(z*² + n − 2) with z* = 1.96, because the t distribution becomes normal; the lookup box computes that value for any n, printed or not. All values are computed by the same t critical value routine this site uses for its t-test calculators, rounded to 3 decimal places.
Critical value versus power
The table answers "is this r big enough to be significant at α?", not "is my sample big enough to detect a correlation of a given size?". A true ρ = 0.2 is invisible at n = 15 (critical 0.514) and routine at n = 200. Use the power analysis calculator to work out the n for the ρ you want to be able to see, and the correlation coefficient calculator for the exact p-value and confidence interval of an observed r — which is the modern replacement for the table's "between 0.05 and 0.01" verdicts.
Common questions
What is the critical value of r?
The smallest |r| that counts as a real correlation at your significance level, for the number of pairs n you have. With n = 20 pairs at α = 0.05 (two-tailed) the value is 0.444: sample correlations of 0.444 or larger in absolute value reject H₀: ρ = 0, and anything smaller is consistent with chance. It is row n = 20, column 0.05 of the table above.
How is the critical r computed?
From the t distribution: a two-sided test of H₀: ρ = 0 on n pairs has the statistic t = r √(n − 2) / √(1 − r²), t-distributed with n − 2 degrees of freedom. Inverting that for r gives r* = t* / √(t*² + (n − 2)), where t* is the two-tailed t critical value at α from the t table. The table above is that t value re-expressed on the r scale, which is why the critical r only falls as n grows.
Why do I need more pairs to see small correlations?
Because the sampling variability of r shrinks with n, and the price of the test is in critical value, not power. At n = 10 pairs, α = 0.05, correlations must clear 0.632; at n = 30, 0.361; at n = 100, 0.197. A true correlation of 0.2 is practically undetectable with 15 pairs (critical 0.514) but easy to detect with 200. The power analysis calculator tells you how many pairs you need for a target power.
Is the test one-tailed or two-tailed?
The table above is two-tailed: it answers "is r different from zero?" in either direction. If the research question is directional ("is r positive?") the one-tailed critical value is smaller, and the lookup box above switches tails. As with any t-test, the tail choice must be fixed before the data are seen.
What about Spearman’s rho and other non-parametric correlations?
Spearman's rho is tested with the same t form — t = ρ √(n − 2) / √(1 − ρ²) — for n roughly above 20, so this table applies with ρ in place of r. For very small samples, exact tables or permutation tests are preferred. The correlation coefficient calculator reports the p-value directly, which does not need a table at all.
Related calculators
-
Correlation coefficient
Pearson’s r and Spearman’s rho, with the significance test.
-
T table
The distribution the critical r is derived from.
-
Critical value calculator
z, t, chi-square and F critical values at any α.
-
Chi-square table
The cut-offs for tests on counts.
-
F table
The cut-offs for ANOVA and two-variance tests.